Activities
The Data Process
Here's a process we introduce to get you from data to impactful story. Keep scrolling down to learn about the activities we offer for you to run at each step along the way.

The DataBasic Education training programme is based on the ‘Data Culture Project’ and DataBasic which were developed by researchers at the Massachusetts Institute of Technology (MIT) to help organisations build their data culture. We, Data Cymru, have re-worked elements of the website to make it user friendly to education settings. However, you may still see references to ‘organisations’, ‘DataBasic.io’ and / or ‘the Data Culture Project’.
Warm Ups
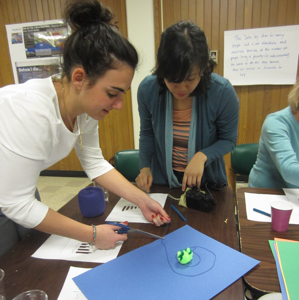
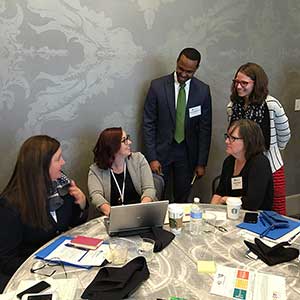
Before jumping into finding data or telling stories, it's important to do some warm ups to activate your organization's data mindset. Warm ups are quick, fun, hands-on activities designed to activate conversation, catalyze creative ideas and build confidence to take the next step. For example, lead colleagues to Build Data Sculptures with craft materials to explore different ways to communicate the same simple data set. Working with pompons, pipe cleaners, or other local materials changes how you approach data, letting you focus on playfully quick ways to look for stories. Deconstruct a dataviz to build your skills in understanding data visualizations, and developing a strong data-driven narrative arc of your own.
Asking Questions
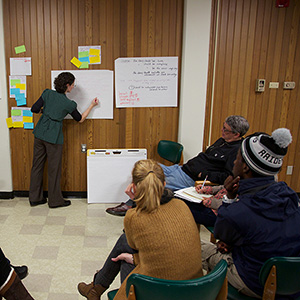
What questions can (and cannot) be answered with data? And once you are staring at some rows and columns, how do you start to make sense of the data in front of you? In this stage, you learn to take the first step in the data analysis process by asking good questions. Use ASKcsv to quickly summarize spreadsheet data, brainstorm questions about it, potential connections to other data sets, and potential biases you might bring to it. Remember – the data never speaks for itself – you help it speak by asking better and better questions. Fill in a Paper Spreadsheet to introduce people to various types of data and help them think about how people fill it in.
Gathering Data
Often you don’t recognize the data you already have! Data is all around, but can be difficult to identify and describe. You need the right data to tell a strong story. As they say, “garbage in, garbage out.” You also need to remember that a single data set may not be able to answer your questions. Combining datasets is often the best way to create a more fleshed out story. Use Connect the Dots to explore crowd-sourcing data from your audience to analyze together as a network. Or Use ASKcsv to think about how to gather the data you need to answer a question.
Analyzing Data
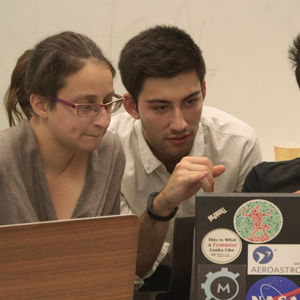
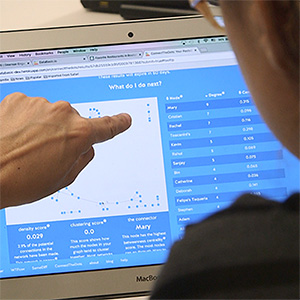
Data can be intimidating, especially when it comes to analyzing it. But remember, most of statistics is just special ways of counting. We’re all pretty good at counting! Establishing a data culture doesn't mean that we will all be statistical wizards but it does mean learning enough about analysis to understand its creative potential. The data analysis process is an opportunity to bring people together. There are many ways to do this to find a story. Use WordCounter to learn about analyzing text data to find stories. Use Connect the Dots to collaboratively analyze a network graph. Use SameDiff to learn about how algorithms can help you analyze data in more abstract ways.
Telling Your Story
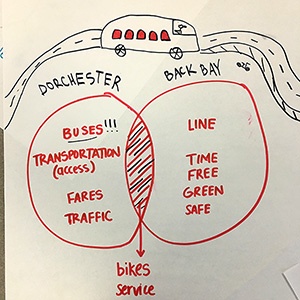
Telling your story is where the rubber hits the road. Numbers alone are not enough to make your case or move people to action. You have to give your data some context, and stitch it together into a narrative so that people can understand it. Sketch a story with WordCounter to practice communicating a data-driven story visually. Make a Word Web to move from abstract ideas and numbers into concrete visual symbols. Remix an Infographic to practice telling the same story in diffferent ways.
Try It Out
How do you know if your story is working? Does the data you included support the narrative you are telling? It can be very difficult to put yourself in the shoes of your audience and try to understand what kind of story will change their worldview or move them to action. And you might have multiple audiences. Each potential audience brings different beliefs and experiences to understanding your message. Try out ConvinceMe to practice telling different stories to different audiences. Write a Data Storybook to practice writing compelling narrative arcs that are supported by the data you are working with.
About the Data Culture Project
The Data Culture Project is an initiative of DataBasic.io. We’ve pulled together the years of work with nonprofits into one place to help you build a data culture. DataBasic.io is the brainchild of Catherine D’Ignazio and Rahul Bhargava.